
A year has passed since I last wrote about Mapletree North Asia Commercial
Trust (MNACT); check it out here. Back then, MNACT was hit with a double whammy in the form of
Hong Kong protests followed by the Covid-19 pandemic.
The Reit took a tumble and closed at $0.790 in 14th May 2020.
Today, the dust has settled a little and it closed at $1.09 as of 29th Apr, a
YTD return of 8.3%. Despite the price improvement, I believe that better days
are ahead for this Reit.
As I have done a thorough analysis in my previous blog post, I won’t go so
in-depth this time around; instead, I will revisit my valuations and share my
thoughts on the Gangnam property acquisition.
Similar to last year, I will be using Sum of the Parts valuation and Discounted
Dividend Model to determine its intrinsic value. As interest rates have
changed, I will recalculate the discount rate.
To determine the discount
rate via CAPM Model
Discount Rate= E(R)= Rf + β (Rm – Rf ) ≈ 6.33
β= 0.94

Rf= 1.610%
 |
| http://www.worldgovernmentbonds.com/bond-historical-data/singapore/10-years/ |
Rm= 6.63%

Distributable income= 72% of NPI
1. Properties in Japan
I must say that these are the sets of properties in MNACT that I like the
most due to their freehold tenure, full occupancy (with the exception of mBAY
POINT Makuhari), and loyal tenants who have occupied the buildings since they
were first constructed – almost as if the buildings were built for them.
Retrospectively, I was overly conservative in projecting a dip in rental
income for the properties acquired in 2019 and zero growth for properties
acquired in 2018. It turns out that there was no drop in Net Property Income
(NPI), but instead a surprise increment of 11.0%.
This was how 11% was derived:
FY19/20
NPI for MPB and OPB (annualized) $1.8mil X 12= $21.6 mil
NPI for Japan properties acquired in 2018= $38.137 mil
NPI FY19/20= $59.737 mil.
FY 20/21
NPI = $66.326 mil
Increment= (66.326-59.737)/(59.737) x 100% =11.03%
For FY20/21 I projected total NPI of $39.937+ $21.362= $61.259 mil.
$66 mil vs $61 mil.
Turns out to be a positive surprise!
The last earnings report showed that the leasing demand in Japan had been stable; unfortunately, Japan was again hit by a resurgence of Covid-19
cases. This led to a quasi state of emergency in parts of Japan such as Chiba,
Tokyo and the other small city states.
As the Covid-19 situation in Japan remains very fluid, I prefer to stick on
the conservative side. I will assume no growth in NPI from 2021 till 2024, and
2% perpetual growth from 2025 onwards.

2. Properties in China – Sandhill Plaza and Gateway Plaza
Sandhill Plaza
If there’s a second favourite property, this would be my pick.
Like most tech stocks, this property is clearly a beneficiary of Covid-19
with a 5% rental reversion from the prior year and high occupancy of 97.9%
during the pandemic. This decentralized business park attracts cost-sensitive
tenants, as there has been a shift in demand towards suburban areas due to economic
uncertainties.
According to reports, 100% of office staff in Shanghai returned to the
office as of April 2020 and the rental market is expected to be resilient. The
majority of tenants consists of growing high-tech, IT, and R&D sectors
which have been less impacted by Covid-19.
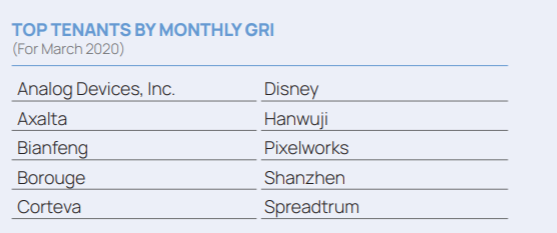
The top tenants seem to be ranked alphabetically, but according to this source, the largest tenant is the entertainment titan, Disney.
Its Compound Annual Growth Rate (CAGR) of NPI stands at 1.24%.
I will assume a 1.24% growth in NPI from 2021 till 2024, and 2% perpetual growth from 2025 onwards.

Gateway Plaza – Beijing
This commercial hub has sadly been a drag on overall earnings. The only
saving grace is that RMB appreciated against SGD and that helped cushion the
dip in earnings. The sponsor also deserves much credit by keeping occupancy at
92%, which is substantially above the average Beijing occupancy rate of 82.2% –
that’s why I always believe in paying a premium for good management.
According to the latest report, Gateway Plaza’s passing rent is
approximately RMB 347.2.
Hence, in my calculation, I will assume occupancy stays at 90% and passing
rent dips by 3% for the next 2 years before recovering at 2% from 2025 onwards
with the same level of occupancy.

3. Property in Hong Kong – Festival Walk
 |
| Festival Walk |
I think the worst is behind this heartland mall with support for HK
protests dwindling after the National Security law was introduced last year.
Moreover, the Covid-19 cases have been well under control with only 1.29 community cases over seven days’ moving average (as of 26th April), to the extent that Hong Kong is
willing to establish a travel bubble with Singapore.
As Festival Walk is a suburban mall which serves the community of Kowloon
Tong (equivalent to Singapore’s Northpoint City, Waterway Point, Causeway
Point), it is less sensitive to tourism and the economy. The recent drop in
retail sales leading to negative rental reversion, in my view, was purely
caused by social distancing measures, dine-in bans, and the closure of the ice
rink during the third wave of Covid-19.
Eventually, when the majority of Hong Kongers gets vaccinated and virus
waves recede, the gradual easing of social distancing measures will bring about
footfall recovery, which will lead to improvement in NPI.
I foresee a gradual recovery in Festival Walk as Hong Kong increases group
size gatherings and eases social distancing rules amid the drop in community
cases. So I will assume a 5% growth in NPI till 2025, followed by modest 2% growth.

3. Property in Seoul – The Pinnacle Gangnam
 |
| The Pinnacle Gangnam |
During Sept last year, management announced the acquisition of The Pinnacle
Gangnam for $528 million. Under the agreement, MNACT holds 50% interest, and
Mapletree Investments own 49.95%. The remaining 0.05% belongs to a third party
investor.
When the news broke, I saw analysts commenting that the acquisition was not
attractive because of potential downward revision of rents when the lease
expires, failing to significantly improve NPI. In my opinion, these analysts
are completely missing the point. I believe the acquisition was intended to
reduce concentration risks by diversifying the overall NPI. It’s like an
investor constructing a diversified dividend portfolio by adding different
dividend stocks to reduce unsystematic risk rather than focus on improving
overall dividend yields.
Personally, I like this acquisition because of two reasons:
1) Yield Accretive
2) Management has a skin in the
game.
Yield Accretive
When a REIT like MNACT got beaten down, its dividend yield increased, and
it would be harder to acquire yield accretive properties. Yet this acquisition
defied all odds and the purchase of Gangnam Property helped to improve overall
distribution per unit, though it’s pretty insignificant; after all, it only
forms 3% of the total portfolio (refer to calculation below). The higher vacancy may be a worrying sign to
many investors, but I think it’s a blessing in disguise as it allows management
to renew the lease at higher rental rates.
I wrote to management a few days ago on Gangnam property and here is the
management’s reply:
As mentioned in our latest FY20/21 results announcement, for the Seoul
office market, demand from the IT, gaming, biotech and pharmaceutical
industries is expected to grow moving forward and The Pinnacle Gangnam is
expected to provide a growing earnings stream to MNACT.
The important keyword here is ‘growing earnings stream’. Although she
didn’t disclose individual lease tenants, I am confident in the sponsor’s
ability to renew or lease out tenants at a higher rental rate.
The chart below shows the rental has been steadily increasing and this website shows that Gangnam is up for rent for ₩2810/sqft/month. After some calculation, the rental is
about ₩99,888 as projected.
1 Pyeong :35.5832 Sqft
Asking rent= ₩2810*35.5832 /Pyeong/month = ₩99,988.792 Pyeong/month, which is in line with projection shown below.

Management has a skin in the game
Secondly, the sponsor continues to hold almost half of the property in
Seoul and that is great. Management can talk whatever they want but I think the
best vote of confidence is putting one’s own money on the line just like
outside investors.
Calculation
Its five months gross revenue is $4.8mil and annualizing
would be $11.52mil.
Similarly its five months gross NPI is $3.8mil , and yearly NPI is expected to
be $9.12mil.
NPI yield= 79.17%
Contribution to NPI= 9.12/(Total NPI for HK & China & Japan+9.12)*100%
9.12/(6292.040+9.12)*100%= 3.029%
 |
| Source: https://links.sgx.com/FileOpen/1_MNACT_ResultsAnnouncement_22Apr2021.ashx?App=Announcement&FileID=662108 |
As management is optimistic on this one and I share the same sentiments,
I would assume a perpetual increment of 1% in rental throughout.


you so much for spending time to read my blog and I really appreciate you. If
you enjoyed reading my blog, hope you can support me by liking my Facebook
page here or share my post. Currently, I do not earn any fees
through any affiliate programme or sponsor. If you have any queries, feel free
to post them and I am happy to take questions! 🙂
I personally bought at 0.75 sold at 0.9 during the COVID period, and buy-sell a few times with maybe 1-2k profit between 0.9 to $1.
I have recently bought back at 1.01 average price with 67,500 shares. I am not selling anymore from here onwards.
The only way for this REIT is up and is currently the most under-valued REIT with the best sponsor at 6% yield – it is bound to return to at least <5.5% yield with rest of the mapletree/capland sponsor back to <4.5%. All the best!
I Always had confidence in MNACT, holding 90,000 shares at about 0.98cts
will remain entrenched
Hi Raj!
Nice! I am gonna hodl on MNACT too!
Hi FutureValue,
Nice, I love the yield and just it should do well as long as HK don't see the next wave of Covid 19.
Thanks! Agree that Mapletree is the best sponsor! No other sponsors come close!