
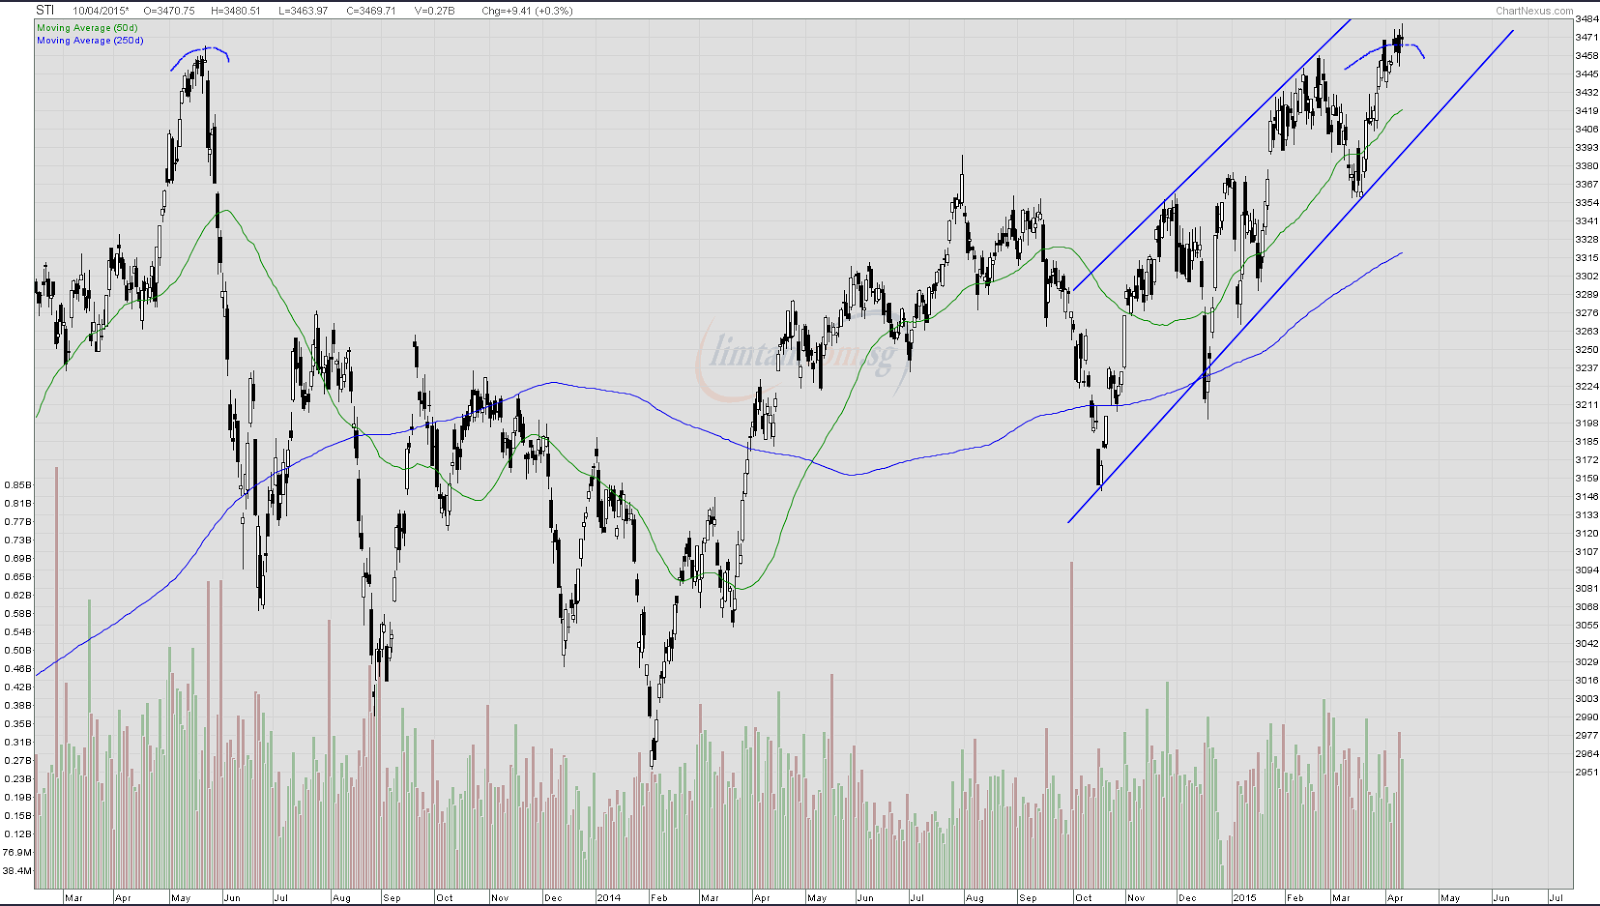
Let’s look at STI.
From the chart you can see that STI is approaching the resistance level of about 3464 which has not been broken since May 13′. I still remembered it was May 22 back then where a series of bad economic reports came in at the same time. Mainly China registered weaker than expected job data and a contraction in manufacturing activity. Ben Bernanke, back then Federal Reserve Chairman looking into possibility of increasing interest rates and scale down QE earlier than expected, Japan registered weaker than expected jobs data….
As for today, STI is testing the in 3.45k region and from Technical Analysis point of view it looks like a double top, suggesting a bearish reversal. To understand more on double top , read this : Double Top.
Another possibility is that it ll break 3.45-3.46k levels and go up higher. Honestly, it’s quite difficult to tell which direction it’ll be moving, coupled by the last 4 days of black candlestick and closing with a long shadow today…It suggests uncertainty with abit of bearishness.
So if daily chart can’t provide a clear picture, we should look at the weekly chart..

I think the weekly chart sheds more positive light than the daily chart. The last 4 candlesticks are white and doesn’t suggests any reversal pattern. As technical analysis is all about probability , there is no sure way of telling which direction STI will go on Monday.
It could be possibly be a pullback to 3.42-3.43k levels before it breaks 3.5k ,and I highly doubt it will break the bottom upward sloping trend line,because…
From the current economic situation:
1. China lowing Interest Rates
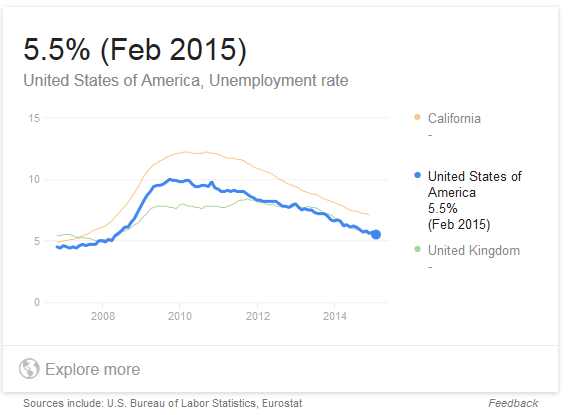
2. US unemployment rate at 5.5% all time low. Good enough that they are considering rise in interest rates (left)
3. ECB Printing Money to Stimulate the Economy.
Looking at all these three points, personally I am more convinced that STI will continue to go up higher. STI PE of 14, with earnings yield of 7.14%, I find it reasonably cheap, relative to the S&P of 20.44
+0.09 (0.45%). (as of today).
Q : So how cheap isit?
PE of 14 suggest an earnings yield of 1/14*100%= 7.14%. So for every $100 you invest in a business, it earns $7.14. I find this rate attractive and I have been buying the index ETF since last year and still buying via POSB Invest Saver.
So if you believe there’s more upside to STI, it’s a good time to accumulate blue chips because if it’s a sooner or later thing to 3.5k, the resistance at this level will turn to a strong support. Bank shares are good..
Due to my upcoming exams and FYP and demanding Spanish classes (everyone is so smart), I ll limit to max of one post a day, and probably will write more after my FYP thesis presentation on 11th May.
I haven’t been so active in my investment recently though due to much stress going through in my life and I have been feeling very tired and losing appetite. As a Christian , I will continue to trust God I have decided to surrender all this to God . Be it in studies, work or investment, I am not in a battle with what everybody else thinks anymore. I ll just do my best and let God to the rest…
Appreciate if you’ll can drop me some feedback or suggestions for improvement i.e. things you would want me to cover, thanks!
God bless.