
Few weeks
back, Mapletree Industrial Trust released their quarterly earnings and at the
same time, announced a joint venture with Mapletree Investments to acquire 14
data centres. This shouldn’t come as a surprise, as they have made known their
investment strategy on 26th Sept 2016 to explore established data centre
markets.
It was
funded via bank borrowing and private placement of 68million shares to
institutions and other investors at the issue price range of $1.83 to $1.90. It
was 3.3x oversubscribed and price at the top range at $1.90, suggesting strong
institutional demand.
funded via bank borrowing and private placement of 68million shares to
institutions and other investors at the issue price range of $1.83 to $1.90. It
was 3.3x oversubscribed and price at the top range at $1.90, suggesting strong
institutional demand.
MIT was
the first share I have ever own and bought it during it’s IPO. Back then I was
in my final months of NS and I went to subscribe 3,000 shares at the ATM
machine using all my savings. I was lucky that to be alloted 1,000 shares because I
was told that a good IPO with Temasek backing is hard to get. It opened at $1.00 and I thought I was
even luckier by selling it at $1.20 months later after collecting more than 2
rounds of dividends. I thought of buying back when it dips below it but it had
gone upwards since then. However, I added 2000 shares at $1.84 in August after
having some spare cash for that month and they announced the acquisiton after. Here are some of the reasons why I find the acquisition makes sense.
Freehold
One of
the concerns I had all the while was its short leasehold. As of March 2017, the weighed
average unexpired lease term is about 39.3 (38.8 as of Oct 17) years.
It’s calculated based on land area. However, that’s also the reason that it’s
able to obtain a higher yield compared to other Reits as leasehold properties
require lesser capital to purchase, and tenants are not affected by the
leasehold years. The downside is having to constantly acquire properties to
improve the average lease term.
If we
were to calculate based on Gross Revenue, for FY16/17, total revenue collected
for leasehold properties less than 21 years would be $41,699,000 of total
revenue of 161mil, which is about 25%.
were to calculate based on Gross Revenue, for FY16/17, total revenue collected
for leasehold properties less than 21 years would be $41,699,000 of total
revenue of 161mil, which is about 25%.
After the data centre acquisition, it would strengthen it’s porfolio by
lengthening the land lease as it now forms 24.4% of its total portfolio by
land area.
lengthening the land lease as it now forms 24.4% of its total portfolio by
land area.
Accretive
Acquistion
Acquistion
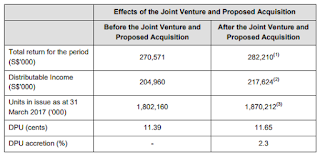
The joint
venture is also said to be yield accretive, as the acquistion of the data
centres increases the distribution per unit (DPU) despite the dilution effect.
venture is also said to be yield accretive, as the acquistion of the data
centres increases the distribution per unit (DPU) despite the dilution effect.
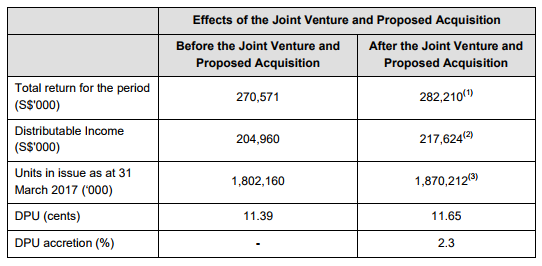
This means
more distributable income to shareholders without the need to fork out
additional cash. Although the loans would increase net debt to 34.7%, it is still
averagely lower compared to other industrial reits.
more distributable income to shareholders without the need to fork out
additional cash. Although the loans would increase net debt to 34.7%, it is still
averagely lower compared to other industrial reits.
 |
| MIT’s net debt to asset is below the average after the acquisiton |
Rental
Escalation
Escalation
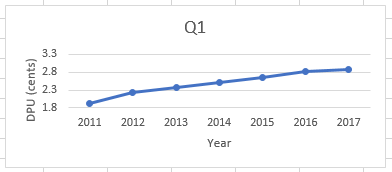
If you
have been monitoring First Reit and Parkway Reit in Singapore, you will realize
that their DPU increases every quarter (when compared Year on Year).
have been monitoring First Reit and Parkway Reit in Singapore, you will realize
that their DPU increases every quarter (when compared Year on Year).
Here’s
how the rent review mechanism is calculated, which explains why PLife Reit
managed to grow their DPU every year, consistently.
how the rent review mechanism is calculated, which explains why PLife Reit
managed to grow their DPU every year, consistently.
The
reason is because of the build in mechanism for rental escalations. In the case
of the data centre, it’s an annual rental escalation of at least 2%.
reason is because of the build in mechanism for rental escalations. In the case
of the data centre, it’s an annual rental escalation of at least 2%.
Recently
I read a Business Times article about the way Reits compute rental reversions.
There is no uniform way of calculating rental reversions and it’s not mandatory
to disclose it.
I read a Business Times article about the way Reits compute rental reversions.
There is no uniform way of calculating rental reversions and it’s not mandatory
to disclose it.
For
instance, Keppel Reit’s rent reversion only applies to new, renewal and foward
renewal leases. Review leases, which refers to long leases, are not included.
This was mentioned in the regulatory filing earlier this year. However
in Q3 reporting, it was mentioned that rent reversion were positive at 3% for
the first nine months.
As for
Mapletree Industrial Trust, they didnt specifiy any rental reversion policy. Basically
they just disclose the gross revenue and net property income in every financial
period. As to whether they have any reversion for review lease or just renewal
lease, your guess is as good as mine. I will write to Investor Relations team (suggested by Kyith from Investment Moats) and update you if they reply.
Other
positive points:
positive points:
-reduced maximum risk exposure to a single tenant
-increased WALE
Growing
Dividends
Dividends
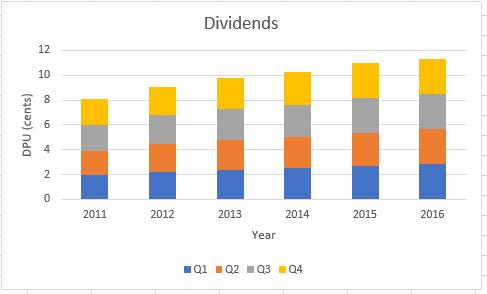
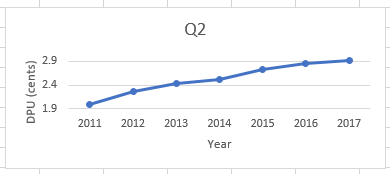
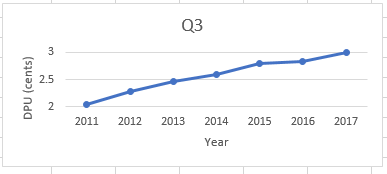
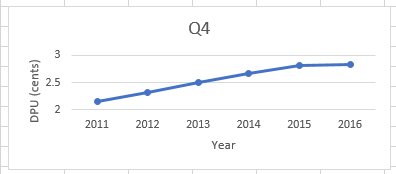
In the past few years, it had dividend reinvestment
plan (discontinued) which allows shareholder to automatically reinvest dividends and capital
gains distributions. Investors who chose to take cash instead would see their
shareholdings diluted by the new issued shares. Some reits reported higher distributable income after rights or drip, but dpu drops because of the
dilutive effect. As for MIT, despite share dilution, its dpu has been always
higher than the previous year’s quarter since it’s listing. The industrial REIT
that sees dividend growing every quarter when compared year on year is
Ascendast REIT. (with an exception in Yr 2013). Thats also the reason that it’s
trading at a premium to NAV of 1.4X.
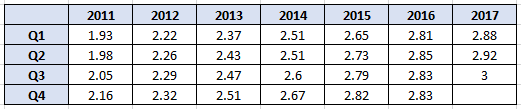 |
| MIT’s quarterly DPU (in cents) |
In my opinion, it all boils down to the management,
who has been very prudent in their investments to enhancing shareholder’s
value.
who has been very prudent in their investments to enhancing shareholder’s
value.
Being in the sales line, I do know that tomorrow’s
success is determined by our efforts today. Like what Warren Buffett had said, someone is sitting in
the shade today because someone planted a tree a long time ago.
success is determined by our efforts today. Like what Warren Buffett had said, someone is sitting in
the shade today because someone planted a tree a long time ago.
In the case of MIT, it is able to grow it’s
dividend partly due to AEI through funds from Dividend Reinvestment Plan
(DRIP) and alwyas having visible pipeline of projects coming up. The coming ones will be 30A Kallang Place and
Kallang Basin 4 Cluster (AEI) and a new data centre for HP. The management are
able to ensure that new projects are able to contribute to the distributable
income to offset any loss of dividends from lower occupancy or drop in rental
yield.
There is a saying that you can’t have your cake and
eat it. If Mapletree Industrial Trust has good management, growing dpu, low
gearing, what’s the catch?
eat it. If Mapletree Industrial Trust has good management, growing dpu, low
gearing, what’s the catch?
1.4x book value
In my opinion, the downside is that it’s trading
quite above book value, 1.4X, and since it’s listing it has never traded at a
discount to book value. I guess that’s the premium for good management and
a reputable sponsor. You got to give it to them for growing the dpu in
challenging times and enhancing shareholder value. I am often more inclined to buy Reits managed by a reputable Reit Manager. My favourites are: Parkway, Capitaland, Fraser and Mapletree.
Lower dividend yield compared to peers
Secondly, it’s dividend yield is lower than it’s
peers. At $1.97, MIT is trading at a premium to book value, hence it’s yield is
lower.
peers. At $1.97, MIT is trading at a premium to book value, hence it’s yield is
lower.
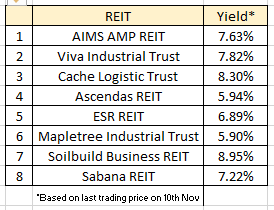
However, the dividend growth is equally important
too as MIT managed to grow it’s dividend at a rate of 6.87%
too as MIT managed to grow it’s dividend at a rate of 6.87%
Valuation
For a company with reputable sponsor, I thought the valuation is likely to be the Archilles’ heel analyzing it’s value. Though
great companies are likely to be cheap especially in the bull market, we have
to calculate and ensure we aren’t overpaying or else we are unlikely to receive
a decent return on investment.
As the purpose of buying Reits is for stable dividends, we would use dividend discount model.
Two stage dividend discount model


For a company with reputable sponsor, I thought the valuation is likely to be the Archilles’ heel analyzing it’s value. Though
great companies are likely to be cheap especially in the bull market, we have
to calculate and ensure we aren’t overpaying or else we are unlikely to receive
a decent return on investment.
As the purpose of buying Reits is for stable dividends, we would use dividend discount model.
Share price = Dividends one year from now / (Discount rate- Dividend Growth Rate)
For individual investors, we can use Capital Asset Pricing Model (CAPM) to determine the discount rate.
Discount Rate= Risk Free Rate – Beta (Market Return – Risk Free Rate)
E(R)= Rf + β (Rm – Rf
)
)
For this exercise, I’ll use Risk Free rate, Rf to be 10 Year Singapore Government Securities (SGS), which is 2.13%
Beta, β to be 0.43
As for markets return, Rm , I will be using STI ETF’s return since inception till 30th Oct, which is 7.52% (with dividends reinvested).
10 year STI returns is about 1.83%. To be on the conservative side, lets use the higher return, 7.52%
This gives us a discount rate of 4.4477%.
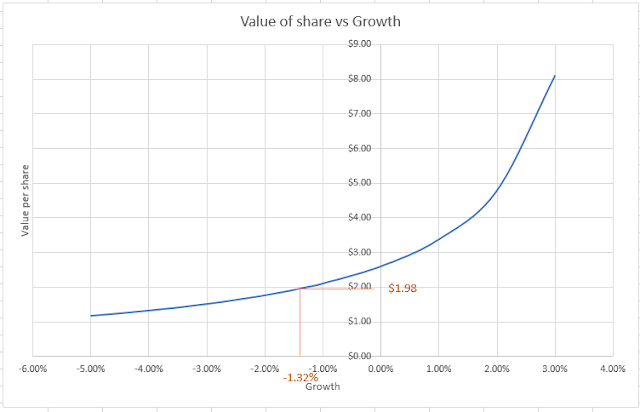
Since inception till end 2016, the dividend growth rate of MIT is about 6.87%. If applied to dividend discount model, the value price per share becomes negative.( Dividend Growth Rate > Discount Rate) However, this is the assumption that it will keep growing it’s dividend forever at this rate which may not be sustainable. Even as the growth rate approaches cost of equity i.e. 4.4477%, the value approaches infinity.
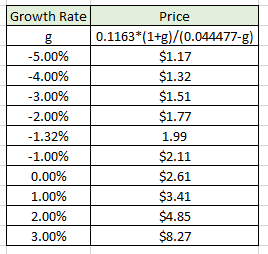
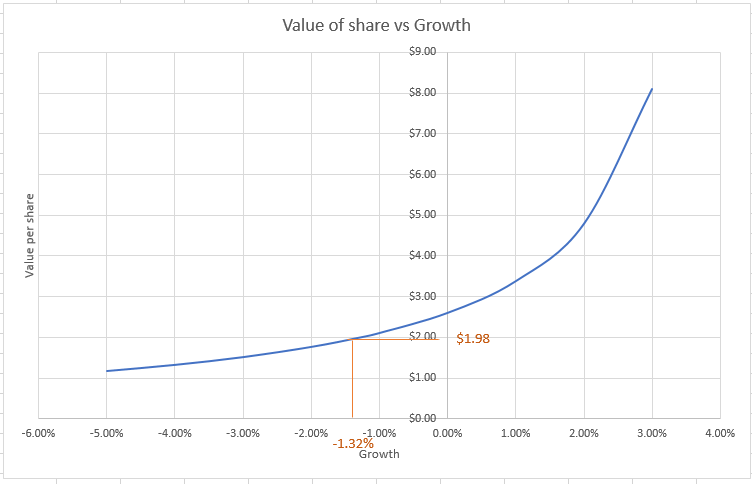
To find growth rate which market is current valuing, we can do up a value per share as a function of expected growth rate graph. In this case, the implied growth rate would be about -1.32% to justify the share price of $1.980. So market is pricing MIT at -1.32% drop in yearly dividends if all my assumptions hold.
Two stage dividend discount model
Perhaps I am being too optimistic by assuming dividends are going grow at 6.87% forever. In most cases, companies go through two or more stages of growth, where it begins with an extraordinary growth stage and gradually to a stable growth phase which lasts forever.
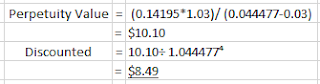
MIT was listed in late 2010, so lets assume 10 years of growth stage (since listing in 2010) at rate of 6.87% and subsequent perpetual growth rate of 3%. In this calculation, we will ignore any capital gains.
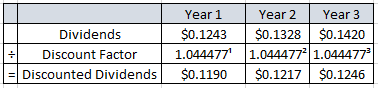
Discounted Dividends (Year 1 to Year 3) = $0.1190 + $0.1217 + $0.1246 =$0.3653

Total Equity value= Discounted Dividends (Year 1 to Year 3) + Discounted Perpetuity Value= $8.85
$8.85 is extremely high and it’s definitely overvalued. The yield will become 1.3% and paying 12X book value.
I relooked at my calculations and the variables used yet I find the assumptions used are quite reasonable. I searched online on CAPM model and found an article about it’s limitations. As the CAPM calculates the required return for risky assets, it measures risk based on the beta. Beta is actually the relative volatility of the investment compared to the market and a more volatile stock gives a higher beta value.
However, value investors like Warren Buffett, do not associate risk based on its volatility. Rather they assess its fundamentals to determine it’s risk. Hence, investors who uses CAPM model are not getting the required return based on true measure of risk..
To test it out the extent which beta affects the valuation, we can try out some sort of sensitivity analysis and we can also find out the implied beta at current market valuation.
Using a two stage dividend discount model and same assumptions,
Present value of dividends for the first 3 years:

Discount factor= 1 +Rf + β (Rm – Rf )
=1+ 2.13% + β
(7.52%-2.13%)
(7.52%-2.13%)
=1+ 0.0213 +0.0539β (above)
Present value of terminal price= $(0.1420* 1.03)/(0.0539β-0.0087)/(1+0.0213+0.0539β)⁴
Derivation
(discount rate- growth rate)
=2.13% + β (7.52%-2.13%)- 3%
=-0.0087+0.0539β (above)
=1+ 0.0213 +0.0539β → discount to present value (above)
Hence
adding all up:
adding all up:
Price= Discounted dividends for 3 years+ Present value for stable growth
Price= 0.1243/(1+0.0213+0.0539β)¹ + 0.1328/(1+0.0213+0.0539β)² + 0.1420/(1+0.0213+0.0539β)³+0.146212/(0.0539β-0.0087)/(1+0.0213+0.0539β)⁴
 |
| Implied beta at $1.98 is about 1.32 |
The analysis suggest that the dividend discount model gives a very high valuation for low beta stocks, and the valuation derived is very sensitive to small increments in beta. This is why sometimes I avoid using valuation fomulas in calculating intrinsic values as some fomulas gives the theoretically right answer, but doesn’t work well practically.
A better way is to determine the discount rate based on our perceived risk on the industry or the stock, rather than measure of volatility. For instance, I would use a higher discount rate for cyclical industries i.e. Oil&gas, whereas for more defensive sectors such as healthcare or companies that consistently generate free cashflows, I would apply a lower discount rate. Another suggestion for discount rate in valuing reits is to use the rate that I should be minimally compensated for. I would compare the returns to SGX-S-REIT 20 Index. You can check it out here. SGX.com → Indices → Search for SGX S-REIT 20 Index and download it’s fund factsheet. The 5 year asnnualized returns are about 11.9% as of June 2017.
Thanks for reading my posts. I have been adding more shares during these past few months as the market is trending up.I hadn’t got time to update my Facebook on my stock transactions because of work commitment and I was overseas last month too. Will be travelling again next month and the month after..
Will do an update and list out all my buy/sell shares hopefully by this month.
If you would like to follow my blogpost, you can do it by liking my Facebook page here
In these few months of bull market, how has your portfolio been performing?
Hi flyfox, thanks for this excellent write-up. MIT is on my watchlist. Hope to get it during the next market correction.
Thanks Dividend Warrior for dropping by and your compliment!
Sure, I am looking to add more too if Mr. Market presents a buying opportunity. Good luck to you!
Thank you for sharing such valuable and helpful information, tips and knowledge. This gives me more insights on this. I would love to see more updates from you.
stock recommendation singapore
SGX trading tips